
How to create an OTM parser
How to create an OTM parser
The Open Threat Model (OTM) standard has been designed to allow greater connectivity and interoperability between threat modeling and other parts of the Software Development Lifecycle (SDLC) and cybersecurity ecosystem. It’s a simple and tool agnostic YAML (or JSON) format that is easy to get started with and describes the essential elements and properties of a threat model. For more information on the specifications of the standard, see https://github.com/iriusrisk/OpenThreatModel.
In addition to the open standard, the IriusRisk threat modeling platform provides an API that can automatically parse OTM files to create a full IriusRisk threat models using the powerful rules engine and extensive library content. This article will focus on creating an OTM file from Graphviz and will only use screenshots of IriusRisk to show what it would look like as a threat model.
Parsing a Graphviz threat model
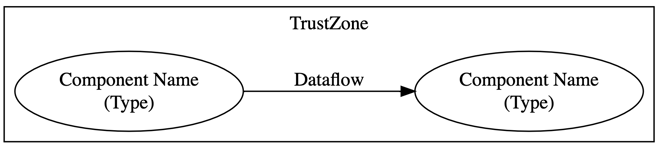
Before we get started we need to decide how to represent a threat model using Graphviz. To keep things simple we can use a couple of conventions:
- A trustzone is represented by a subgraph
- Components are nodes within a subgraph, and all components must be in a subgraph (trustzone)
- Node labels are the name of the component with a line break and the component type in parenthesis
- A dataflow is just an edge between components, either within a subgraph or between subgraphs.
This figure illustrates our DOT threat model convention.
Using this convention, we can create a simple threat model as a DOT file.
digraph G {
rankdir=LR;
subgraph cluster0 {
label="Internet";
"client" [label="Photo Client\n(web-client)"];
}
subgraph cluster1 {
label="Public Cloud"
"web" [label="Upload Service\n(web-service)"];
"database" [label="Image Database\n(other-database)"];
}
subgraph cluster2 {
label="Trusted Partner"
"api" [label="Analytics API\n(rest-full-web-service)"];
}
client -> web [label="Upload picture"];
web -> database [label="Store picture"];
web -> api [label="Send metrics"];
}
In the above example, we can see three subgraphs each with one or two components, and three dataflows. Using Graphviz to render the DOT file as an image we get something like this:
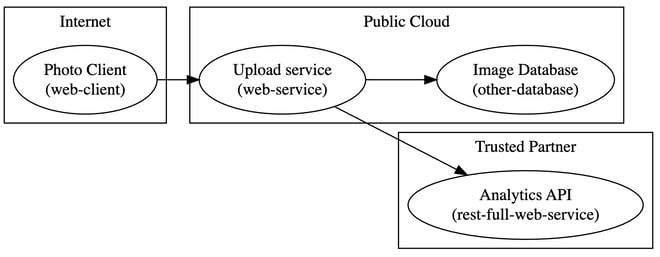
Pretty cool, huh?
Writing the parser in Python
Before we get into the code, we need to come up with a bit of a strategy for parsing the DOT file. In order to generate an OTM file, we’ll need to find all of the trustzones, components, and dataflows. So we will need to do something like this:
- Iterate through each subgraph and create a trustzone for each one
- Iterate through all of the nodes within a subgraph and create a component for each one with the trustzone as the parent
- Iterate through all of the edges within a subgraph, creating each dataflow
- Finally, iterate through any edges outside of the subgraphs, creating a dataflow for each one.
At that point we can generate the OTM file.
There are a few things to note about the Python code we’ll be looking at. To keep it simple, it hardcodes a few things that in a real-world script shouldn’t be hardcoded. We also avoid the use of functions and classes so that we can walk through the logic step by step.
Setting things up
Let’s get started shall we.
This block of code describes the first part of our Python script.
#!/usr/bin/env python
import pydot
import json
# Use pydot to load the dot file into a graph and grab the first (and only) graph
graphs = pydot.graph_from_dot_file("example.dot")
graph = graphs[0]
# We need to map trustzone names to a unique ID in IriusRisk, plus define a trust rating
trustzones_map = {
"Internet": {
"id": "f0ba7722-39b6-4c81-8290-a30a248bb8d9",
"trustRating": 10
},
"Public Cloud": {
"id": "b61d6911-338d-46a8-9f39-8dcd24abfe91",
"trustRating": 90
},
"Trusted Partner": {
"id": "531315a7-41a2-40ed-ab87-22c3a4c3c7ff",
"trustRating": 50
}
}
# Define our OTM data types
trustzones = []
components = []
dataflows = []
This is what’s happening:
- We import pydot as we’re going to use this to parse the DOT file.
- We import json as we’ll use this to save the OTM file. As we’re generating the OTM file and not writing it by hand, it makes sense to use JSON.
- We use pydot to create the graph using a hardcoded example.dot file described above. Of course, for any decent script we should be handling command line arguments etc, but to keep things simple we’ll just hardcode the file. We also assume there is only one graph in our DOT file, so we grab the first one on line 8.
- Line 11 to 24 creates a map that will give us specific identifies that IriusRisk can use when generating the threat model. This is optional and other uses of trustzones could take a different approach to specifying the identifiers. We also set specific trustRatings as used by IriusRisk, but again these could be hardcoded to 100 or any other value as needed.
- Finally, lines 27 to 29 are some simple arrays to store the respective trustzones, components, and dataflows.
Parsing the trustzones
As described above, the next step is to iterate through the subgraphs in order to create the trustzones.
# Create trustzones by looking for subgraphs.
# In our simple example, every component must be in a trustzone, and so must be in a subgraph.
for subgraph in graph.get_subgraph_list():
trustzone_name = subgraph.get_label().strip('"')
trustzone_id = trustzones_map[trustzone_name]["id"]
trustzone_rating = trustzones_map[trustzone_name]["trustRating"]
trustzones.append({
"name": trustzone_name,
"id": trustzone_id,
"risk": {
"trustRating": trustzone_rating
}
})
In the above code we are:
- Iterating through the subgraphs using the get_subgraph_list() function.
- We use the label of the subgraph as the name of the trustzone, stripping the superfluous double quotes from the value.
- We get the trustzone identifier by looking up the trustzone name in the map we defined in the previous section.
- We also get the trustRating from the map.
- Line 7 to 13 appends the minimum OTM data structure for a trustzone to the trustzone array.
Parsing the components
Now we can get on to parsing the components within the subgraph. The following code is still inside the for subgraph in graph.get_subgraph_list()` loop.
# Create components for each node in the subgraph
for node in subgraph.get_nodes():
component_id = node.get_name().strip('"')
component_label = node.get_label().strip('"')
# Split the label into a name and type based on the format 'NAME\n(TYPE)'
(component_name, component_type) = component_label.split('\\n')
component_type = component_type[1:-1] # Get rid of the ()
components.append({
"name": component_name,
"id": component_id,
"type": component_type,
"parent": {
"trustZone": trustzone_id
}
})
Here is what’s happening:
- We iterate through each node in the subgraph and returned by get_nodes().
- We set the component identifier (id) to be the name of the node. This is different to the label. In our example client is the name of a component, and Photo Client... is the label. Again, we remove the superfluous double quotes.
- We grab the label as well because we’re going to have to parse it to create the name and type.
- On line 7 we split the label on the newline character, and on line 8 we basically ignore the first and last characters of the type value in order to drop the parenthesis.
- Lines 10 to 17 appends the minimum OTM data structure for components to the components array, using the trustzone_id as the parent for the trustzone that we are currently iterating on.
Parsing the subgraph dataflows
So at this point we are iterating through our subgraphs to get each trustzone. For each subgraph we have iterated through each node to get the components. Now we need to iterate through any edges within the subgraph in order to get the dataflows.
Remember, all of this is happening inside the for subgraph in graph.get_subgraph_list()` loop
# Find any dataflows between trustzones
for edge in graph.get_edges():
edge_name = edge.get_label().strip('"')
source = edge.get_source()
destination = edge.get_destination()
edge_id = source + "-" + destination
dataflows.append({
"name": edge_name,
"id": edge_id,
"source": source,
"destination": destination
})
For dataflows, we are:
- Iterating through the edges within the subgraph, returned by the get_edges() function.
- On line 3 we set the dataflow name from the label, once again stripping the double quotes.
- We get the source of the dataflow using the get_source() function. This will return the name of the source node, which corresponds to the identifier (id) value in our component.
- On line 5 we do the same thing for the destination using get_destination().
- On line 6 we create a unique identifier for the dataflow by combining the source and destination.
- Lines 8 to 13 appends the minimum OTM data structure for dataflows to the dataflows array.
Parsing the dataflows between subgraphs
Once all of the above as run, at that point we will have parsed each subgraph into a trustzone, and would have parsed each component and dataflow within the subgraphs. Finally, we can parse the dataflows outside of the subgraphs.
# Find any dataflows between trustzones
for edge in graph.get_edges():
edge_name = edge.get_label().strip('"')
source = edge.get_source()
destination = edge.get_destination()
edge_id = source + "-" + destination
dataflows.append({
"name": edge_name,
"id": edge_id,
"source": source,
"destination": destination
})
This essentially requires the same code as above, but we iterate over edges for the graph itself using get_edges(), and not the subgraph.
Creating and writing the OTM
Finally, we need to pull our trustzones, components, and dataflows in to the rest of the OTM data structure and then write it as a JSON file.
# Create an OTM data structure
otm = {
"otmVersion": "0.1.0",
"project": {
"name": "Dot2Otm Example",
"id": "dot2otm-example"
},
"representations": [{
"name": "Dot file",
"id": "dot",
"type": "code"
}],
"trustZones": trustzones,
"components": components,
"dataflows": dataflows
}
# Save the OTM structure as a JSON file
with open("example-otm.json", "w") as f:
json.dump(otm, f, indent=2)
Here is what’s happening:
- We create a hardcoded OTM data structure including key fields such as the otmVersion and representations. See the Open Threat Model specification for more information.
- On lines 13 to 15 we provide the arrays we’ve generated
- On lines 19 and 20 we create our example-otm.json file using the otm data structure.
That’s it, we’re done.
Let’s look at the OTM
So, let’s run our script we could save as something like dot2otm.py.
$ ./dot2otm.py
We don’t have any command line arguments, and we didn’t add any output to our script, but if everything works as expected, we have a new file called example-otm.json.
And this is what that file looks like:
{
"otmVersion": "0.1.0",
"project": {
"name": "Dot2Otm Example",
"id": "dot2otm-example"
},
"representations": [
{
"name": "Dot file",
"id": "dot",
"type": "code"
}
],
"trustZones": [
{
"name": "Internet",
"id": "f0ba7722-39b6-4c81-8290-a30a248bb8d9",
"risk": {
"trustRating": 10
}
},
{
"name": "Public Cloud",
"id": "b61d6911-338d-46a8-9f39-8dcd24abfe91",
"risk": {
"trustRating": 90
}
},
{
"name": "Trusted Partner",
"id": "531315a7-41a2-40ed-ab87-22c3a4c3c7ff",
"risk": {
"trustRating": 50
}
}
],
"components": [
{
"name": "Photo Client",
"id": "client",
"type": "web-client",
"parent": {
"trustZone": "f0ba7722-39b6-4c81-8290-a30a248bb8d9"
}
},
{
"name": "Upload service",
"id": "web",
"type": "web-service",
"parent": {
"trustZone": "b61d6911-338d-46a8-9f39-8dcd24abfe91"
}
},
{
"name": "Image Database",
"id": "database",
"type": "other-database",
"parent": {
"trustZone": "b61d6911-338d-46a8-9f39-8dcd24abfe91"
}
},
{
"name": "Analytics API",
"id": "api",
"type": "rest-full-web-service",
"parent": {
"trustZone": "531315a7-41a2-40ed-ab87-22c3a4c3c7ff"
}
}
],
"dataflows": [
{
"name": "Upload picture",
"id": "client-web",
"source": "client",
"destination": "web"
},
{
"name": "Store picture",
"id": "web-database",
"source": "web",
"destination": "database"
},
{
"name": "Send metrics",
"id": "web-api",
"source": "web",
"destination": "api"
}
]
}
Creating a threat model in IriusRisk
So that point we have taken a threat model created as a Graphviz DOT file and have turned it into a much more usable Open Threat Model file. We could publish and use this OTM file in any number of ways, but what we’ll do now is see what it would look like in IriusRisk.
To create an IriusRisk that model from an OTM file we can either call the API directly using something like curl, or we can use the StartLeft open source tool to upload it for us.
$ startleft threatmodel example-otm.jsonUploading OTM files and generating the IriusRisk threat modelValidating OTM fileOTM file is validOTM file has consistent IDs
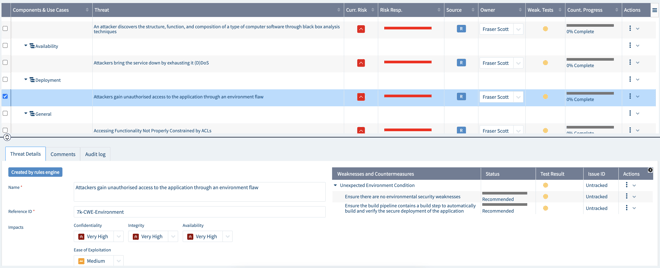
Our generated threat model inside IriusRisk looks something like this:

And as you can see, the rules engine has identified key threats and countermeasures that we would need to consider before building this system.

Next steps
For more information on using the Open Threat Model standard with IriusRisk, check out the Introduction to the Open Threat Model standard.

FAQs

Fraser Scott
